
Record and read the timeline
Record what your components did and in what order, then scrub it. Use it for ordering questions; for “why did this re-render”, go to the Updates tab.
Start and stop recording
Section titled “Start and stop recording”Open the Timeline tab and press ▶ Record. Interact with the page, then press ⏹ Stop. Stopping keeps what you captured.
Recording is shared state, so it does not matter which tab you start it from, and a coding agent can flip it too. Starting again clears the previous recording: the page re-zeroes its timeline clock each time, and events from the old clock would sit in the list on a different time origin.
Clear empties the list without stopping the recording.
The dev server keeps the latest 512 events of the recording. A panel that reloads, or one you open while recording is under way, lists those and carries on from there, so a long session comes back without its oldest events. The panel you recorded in keeps up to 5000 events until you reload it.
Choose layers
Section titled “Choose layers”A strip of coloured pills under the toolbar turns each layer on or off. A layer is one category of recorded timeline events, with its own colour and toggle.
| Layer | What it captures | Default |
|---|---|---|
| Lit Lifecycle | connectedCallback, performUpdate, willUpdate, update, updated, firstUpdated, disconnectedCallback, with per-phase durations and changed-property keys, and an update skipped point event when shouldUpdate returns false |
on |
| Lit Render | begin render and end render, from Lit’s built-in lit-debug events |
on |
| Lit Render (verbose) | Per-binding lit-debug events (template updating, set part, commit text/node/attribute/property/…) — one per part on every render, so it’s high volume |
off |
| Changed values | Adds the old and new value of each changed property to the update events. No events of its own, so it has no track; see Updates | off |
| Mouse | mousedown, mouseup, click, dblclick |
off |
| Keyboard | keydown, keyup |
off |
| Lit warnings | A warning:<code> point event for each warning Lit’s development build issues |
on |
| Custom events | Events a component dispatches with this.dispatchEvent(...): the type, bubbles/composed/cancelable and a short preview of detail |
off |
Your toggles last as long as the session: they go back to these defaults when the dev server restarts, or in the browser extension when DevTools closes.
A custom event row is attributed to the component that dispatched it, so it
links to that component like any other row. Only an element’s own
dispatchEvent call is recorded, not events the browser raises, and the
detail preview is cut short like any value in the panel. One dispatched while
its component is updating shares that update’s group.
An update skipped event means the component’s own shouldUpdate returned
false. Lit still runs performUpdate but skips update and updated, so the
event sits inside a performUpdate bar with nothing nested beneath it, and
carries the property keys that were vetoed.
A warning:<code> event, such as warning:change-in-update, is a warning
Lit’s development build issued, with its code and message in the event’s data.
It is attributed to the element that was updating when Lit issued it, else to
the tag the message names; one issued during an update shares that update’s
group. Lit warns once per message, so a warning issued before you started
recording, or while the Lit warnings layer was off, is added when you start or
turn the layer on, marked replayed. Warning rows are amber with a ! mark,
and selecting one shows the message, the code linked to its explanation on
lit.dev, and whether it was replayed. A production build of Lit issues none.
A phase only reports if the component lets the base class run. The playground
fixture below overrides every hook and calls super on the marked lines, so
all of them show up.
import {LitElement, css, html, nothing, type PropertyValues} from 'lit';import {customElement, state} from 'lit/decorators.js';
/** * Exercises the full reactive update lifecycle so every phase shows up in the * DevTools Timeline's `lit-lifecycle` layer: * *   connectedCallback → (per update) performUpdate → willUpdate → update → *   firstUpdated (first only) → updated → … → disconnectedCallback * * Each hook is overridden and calls `super`, so the timeline (which wraps the * shared ReactiveElement/LitElement base) reports it. The on-screen log shows * the phase order of the last update for at-a-glance correlation; it's written * straight to the DOM in `updated()` so it never triggers another update. */@customElement('hmr-lifecycle-child')export class HmrLifecycleChild extends LitElement {  static override styles = css`    :host {      display: block;    }    button:focus {      outline: 2px solid dodgerblue;    }    .log {      margin-top: 0.5rem;      font-size: 0.75rem;      color: #888;      font-family: var(--font-mono, monospace);    }  `;
  @state()  private count = 0;
  /** Phases seen during the in-flight update cycle (reset each willUpdate). */  #phases: string[] = [];
  override connectedCallback() {    super.connectedCallback();    this.setAttribute('data-connected', '');  }
  override disconnectedCallback() {    super.disconnectedCallback();    // The element is leaving the DOM — nothing visible to update, but the    // wrapped base disconnectedCallback still reports the point event.  }
  override willUpdate(changed: PropertyValues) {    this.#phases = ['willUpdate'];    super.willUpdate(changed);  }
  override update(changed: PropertyValues) {    this.#phases.push('update');    super.update(changed); // runs render()  }
  override firstUpdated(changed: PropertyValues) {    this.#phases.push('firstUpdated');    super.firstUpdated(changed);  }
  override updated(changed: PropertyValues) {    this.#phases.push('updated');    super.updated(changed);    // Direct DOM write (no reactive property) so it doesn't loop.    const log = this.renderRoot.querySelector('.log');    if (log !== null) {      log.textContent = this.#phases.join(' → ');    }  }
  override render() {    return html`      <button id="increment" @click=${() => this.count++}>        Trigger update — count: ${this.count}      </button>      <div class="log">connected</div>    `;  }}
/** * Wrapper that mounts/unmounts the child so its `connectedCallback` / * `disconnectedCallback` fire on demand — they only run when an element * actually enters or leaves the DOM, which a plain re-render won't do. */@customElement('hmr-lifecycle')export class HmrLifecycle extends LitElement {  static override styles = css`    button:focus {      outline: 2px solid dodgerblue;    }    .controls {      margin-bottom: 0.5rem;    }  `;
  @state()  private mounted = true;
  override render() {    return html`      <h2>Lifecycle</h2>      <div class="controls">        <button id="toggle" @click=${() => (this.mounted = !this.mounted)}>          ${this.mounted ? 'Unmount child' : 'Mount child'}        </button>      </div>      ${        this.mounted          ? html`<hmr-lifecycle-child></hmr-lifecycle-child>`          : nothing      }    `;  }}
declare global {  interface HTMLElementTagNameMap {    'hmr-lifecycle': HmrLifecycle;    'hmr-lifecycle-child': HmrLifecycleChild;  }}
Read a row
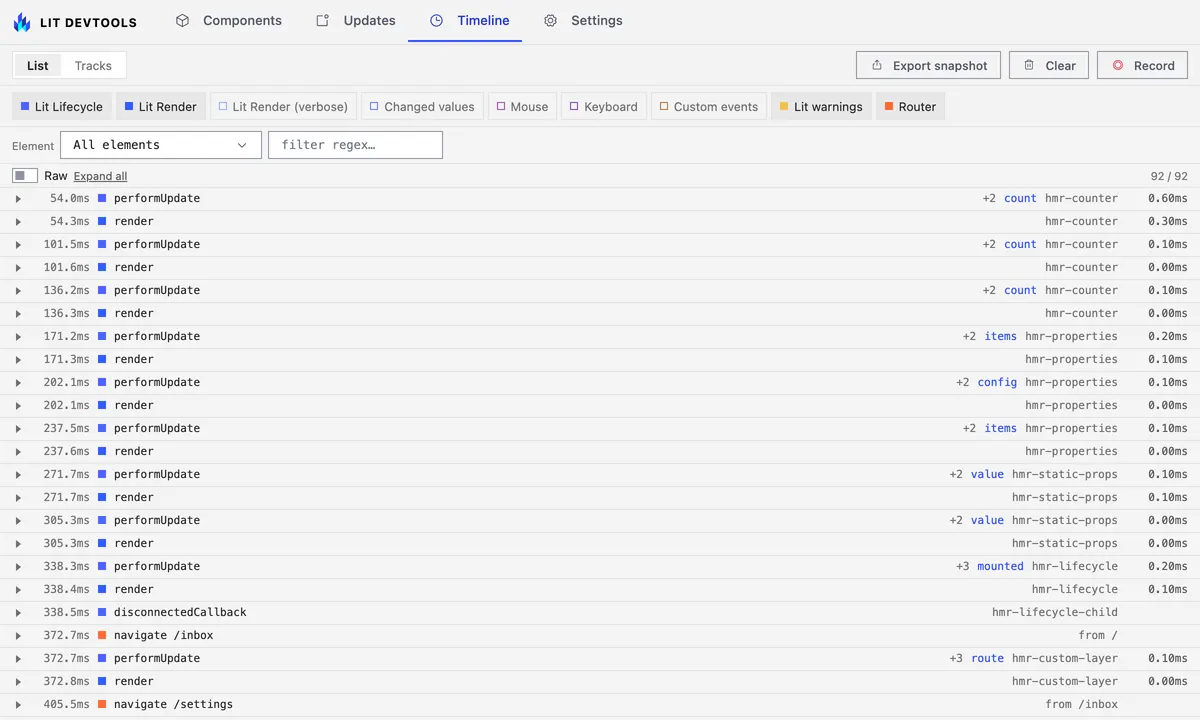
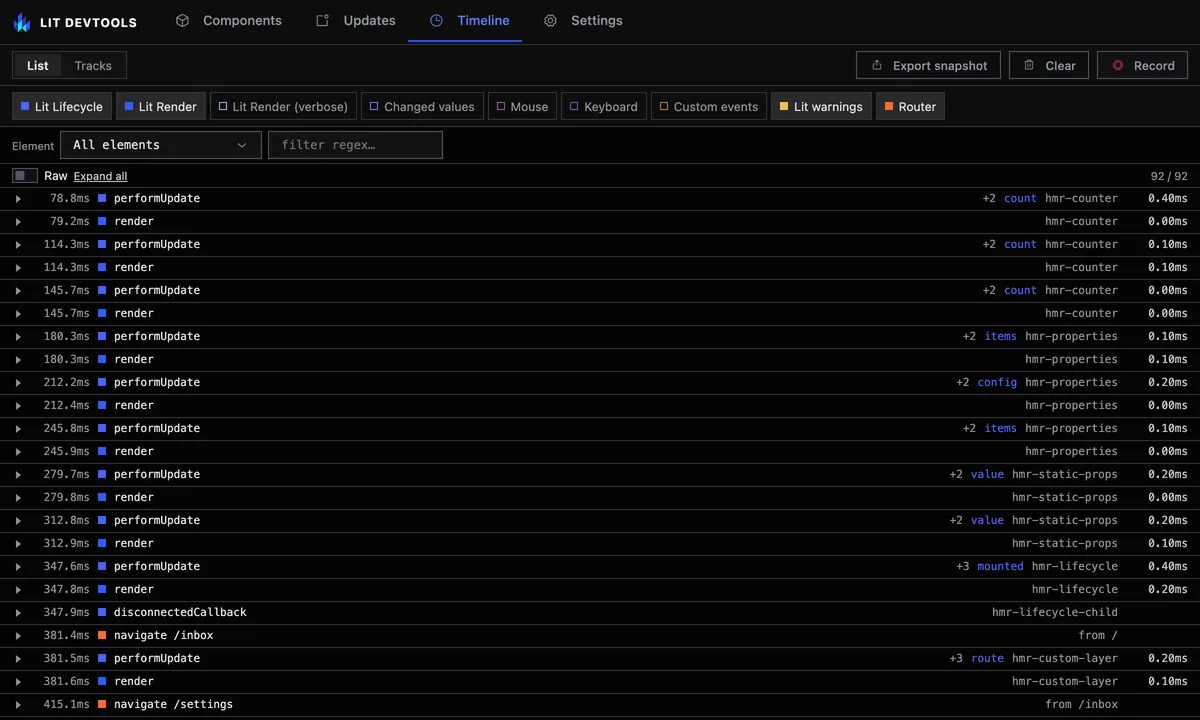
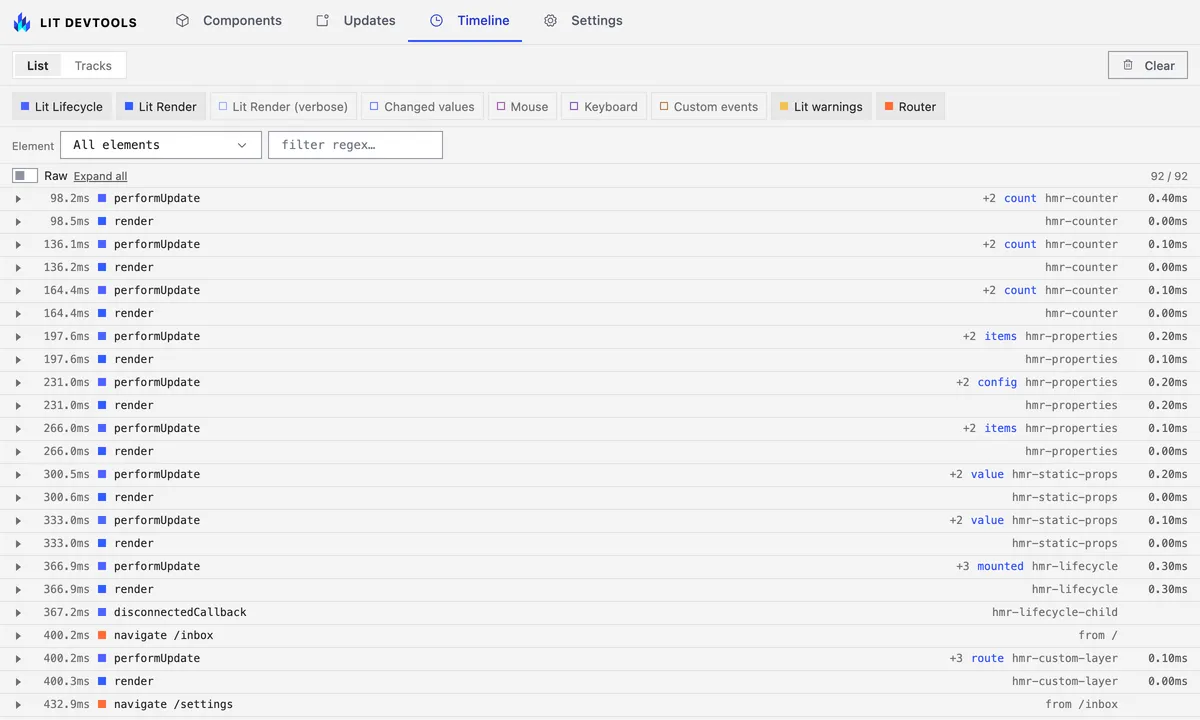
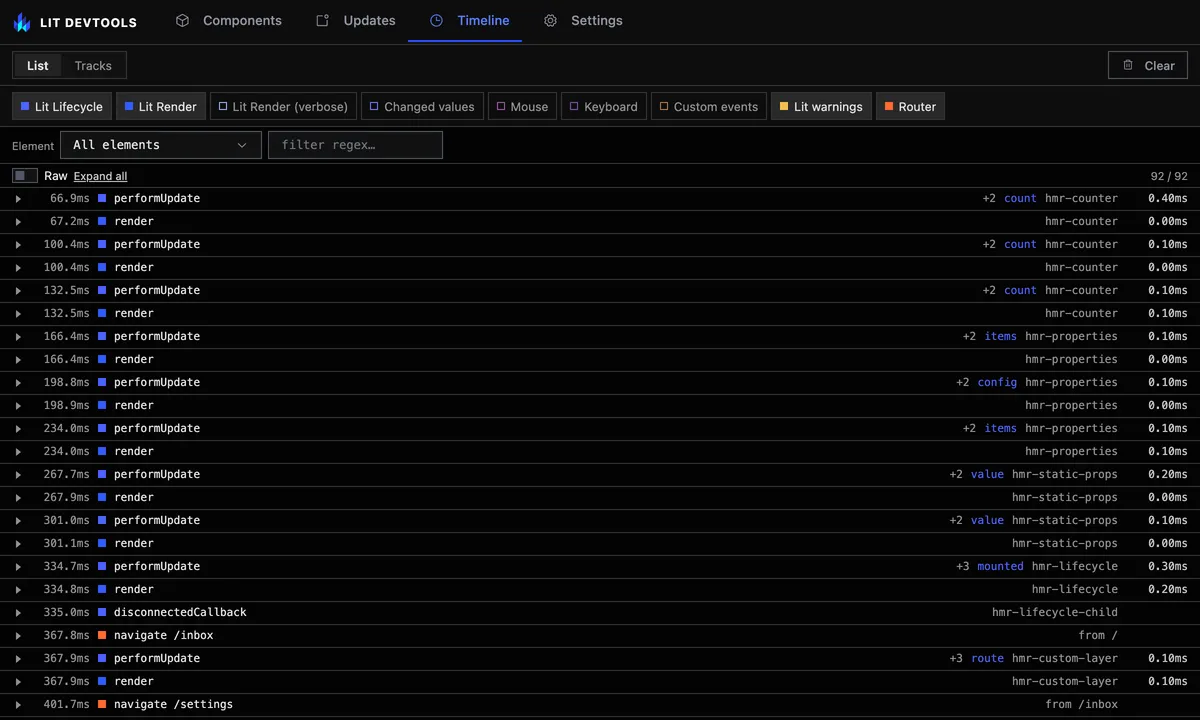
Section titled “Read a row”Switch List | Tracks at the left of the toolbar to List to read the recording row by row. Rows are collapsed spans, not raw events: the capture layers emit a start and an end per phase, so each phase is one row with its duration, and a lifecycle row also lists the reactive properties that changed.
One component update is one row. The list shows the performUpdate row of each
update, collapsed, with its duration, the properties the update changed, and a
count of the rows folded into it (+2). A marker after the count flags an
update with something to look at inside: a warning, an error, or a skipped
update. Press the arrow at the left of the row to open it and see the
willUpdate, update and updated phases, plus the events that belong to the
same update: update skipped, Lit warnings, errors from a rejected updated,
and, with the Custom events layer on, events the component dispatched while it
was updating. With the arrow focused, the Right and Left arrow keys open and
close it too, and Expand all and Collapse all in the filter bar open or
close the phases of every update at once. Rows that are not part of an update
stay as they are.
Rows stay in time order, and a column at the left of the list draws what caused
each update, the way git log --graph draws branches. A line connects an update
to the row that caused it: the update of a parent that set a property on it or
created it, or the click, key or custom event whose handler requested it. The
line runs past whatever happened in between, so a chain of updates reads top to
bottom even when other rows sit inside it. A @lit/task run is a row of its
own, from the update that started it to when it settled, and the re-render it
asks for hangs from it. Each chain has its own colour, and
hovering one of its rows fades the others. The cause is recorded at the
requestUpdate call that scheduled the update, not guessed from timing. An
update with no line is a timer, a signal or a stray requestUpdate(). A chain
whose top has fallen out of the buffer starts at the first row still present.
The details pane names the cause, with a show link that selects it.
Selecting a nested row from the tracks, a #event= link or the range summary
opens its update first. A filter that hides a performUpdate but matches one of
its phases keeps the performUpdate row, showing only the matching phases, so
the match still has its context.
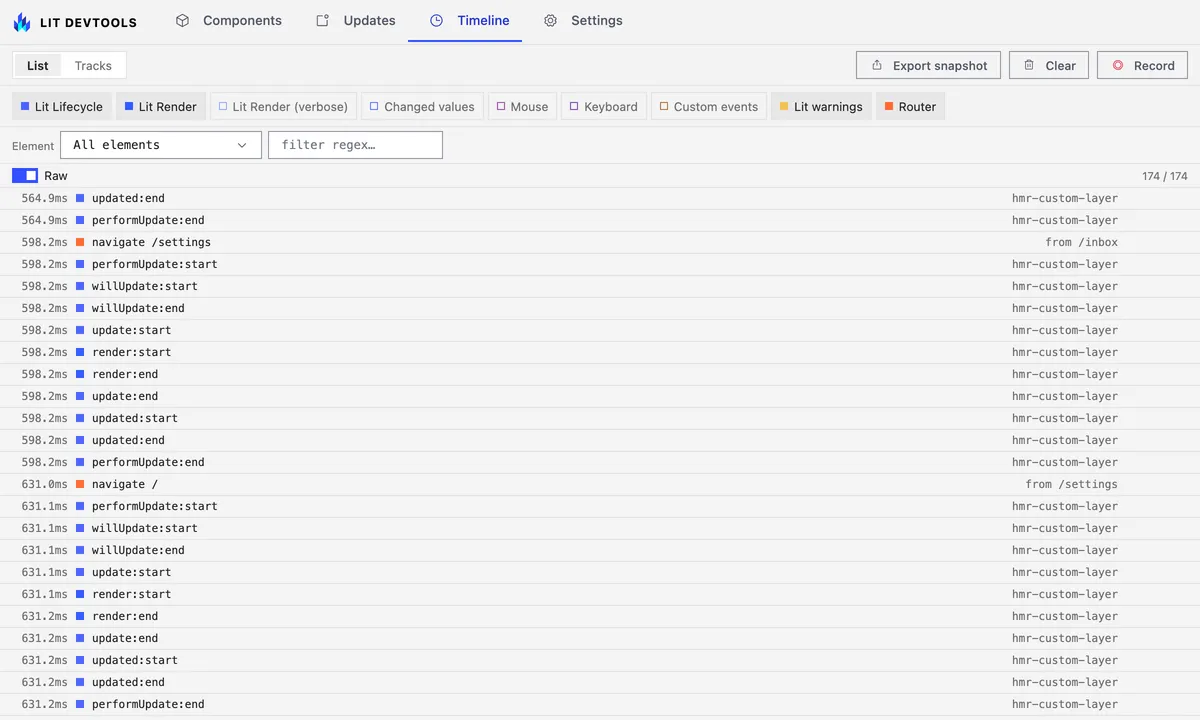
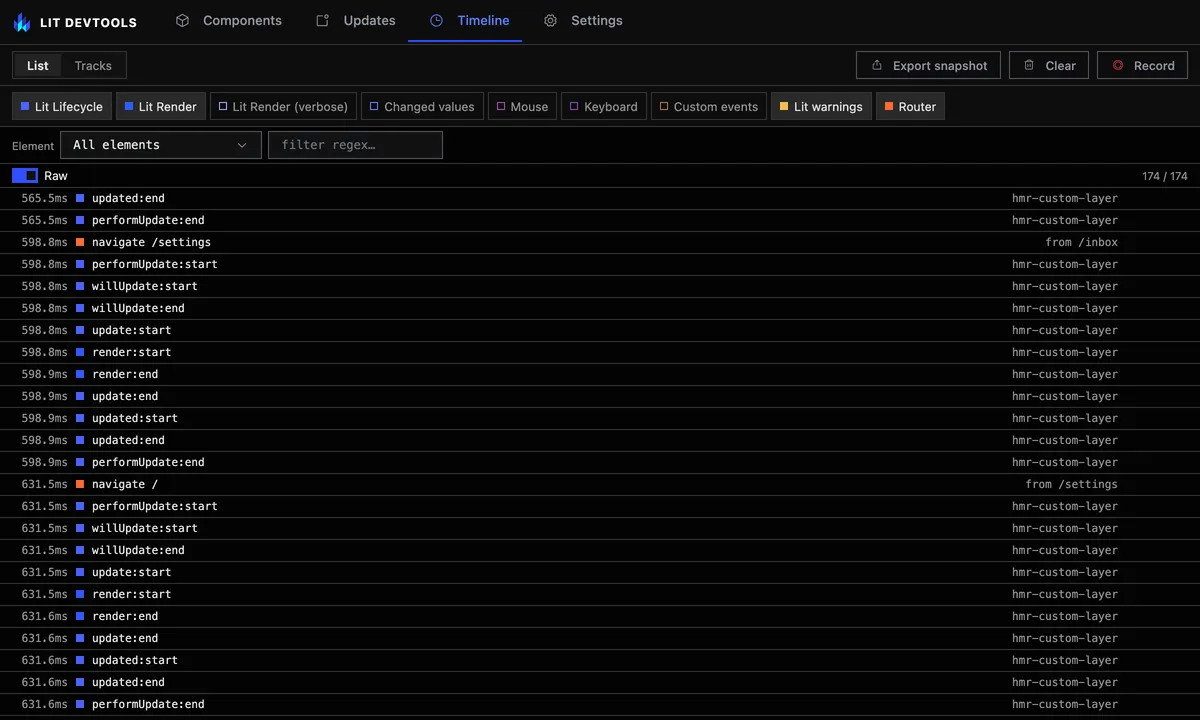
Press Raw in the filter bar for one flat row per recorded event instead. Reach for it on ordering questions, and for custom layers, which have no pairs to collapse.
Click any row to see the element tag name, its stable instance id, the
duration, the changed properties, the source file and the raw event data. Click
the file to open it in your editor. When the element was written in an html
template or in index.html, a rendered at link opens the tag that created
it instead.
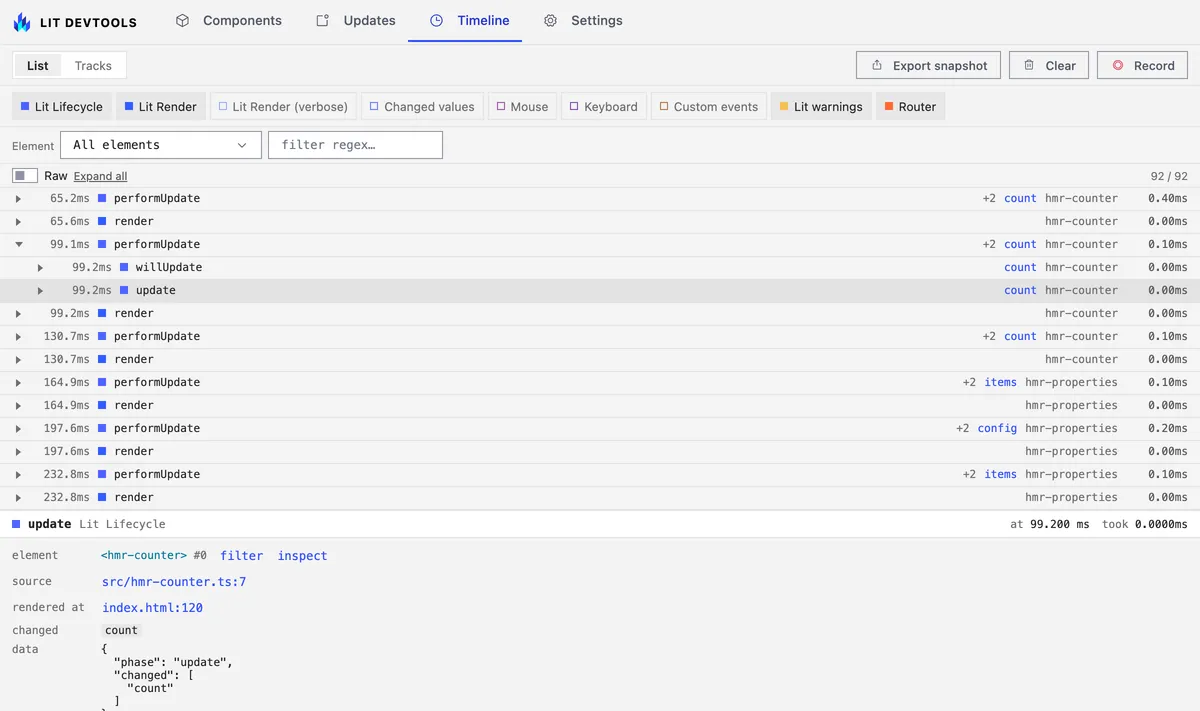
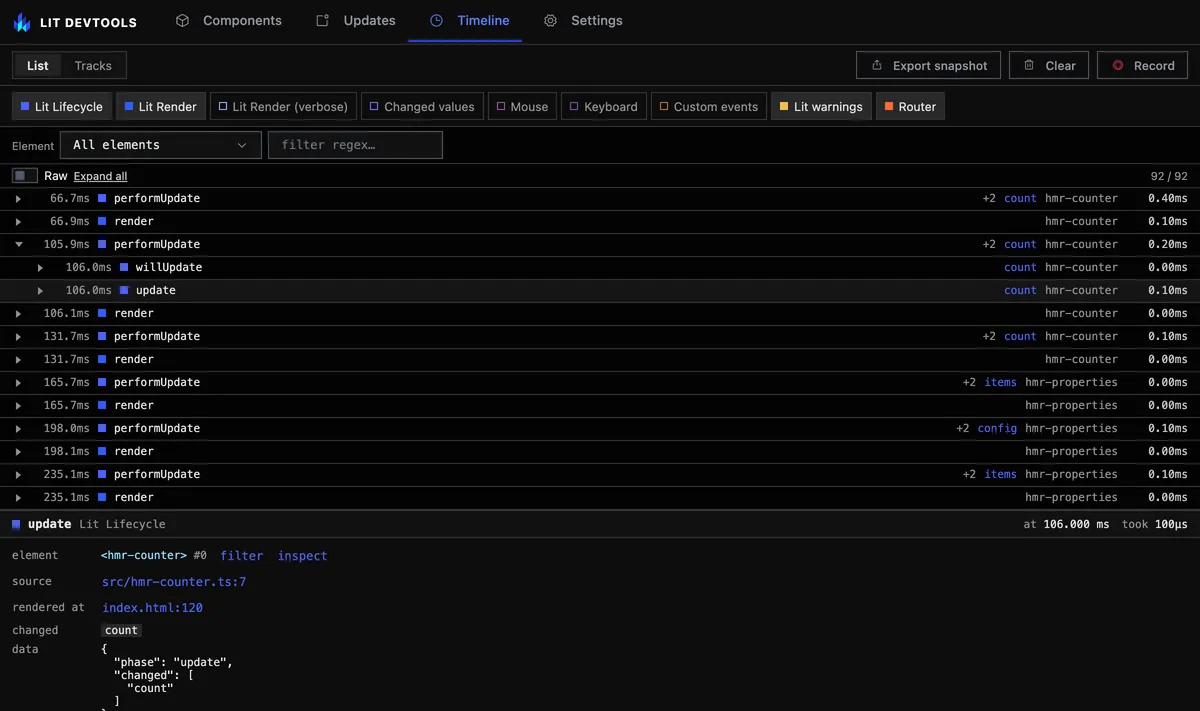
An element row also carries two links. filter narrows the list and the tracks to that element. inspect opens the Components tab on it, because both views use the same instance id.
See it as tracks
Section titled “See it as tracks”The Timeline opens in Tracks: the recording as one horizontal lane per layer on a shared time axis, so you see what happened at the same time and how far apart things were. The list shows order and attribution instead. The panel remembers which view you left it in.
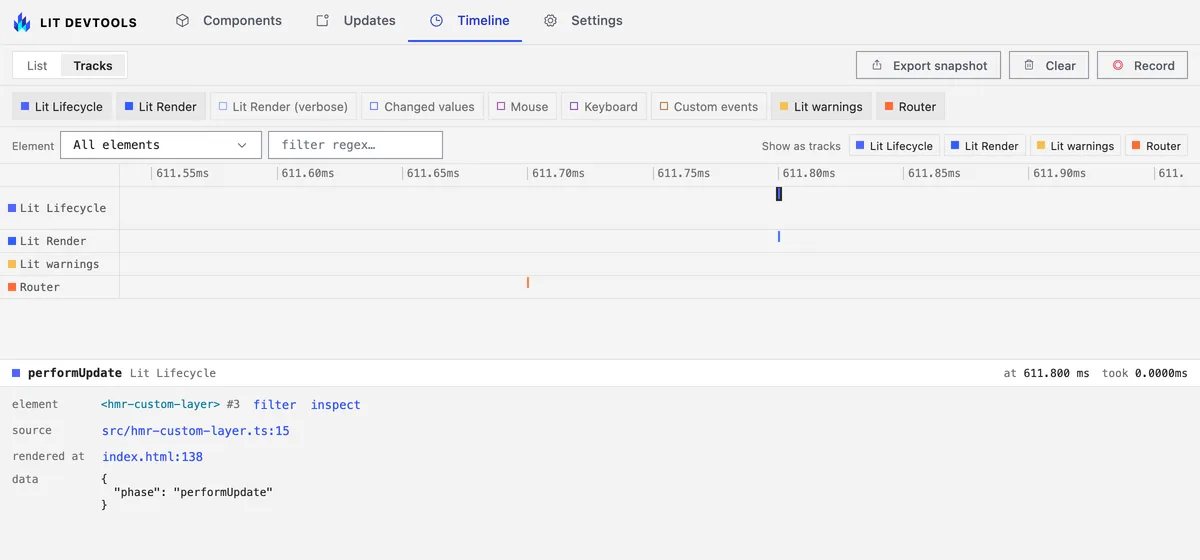
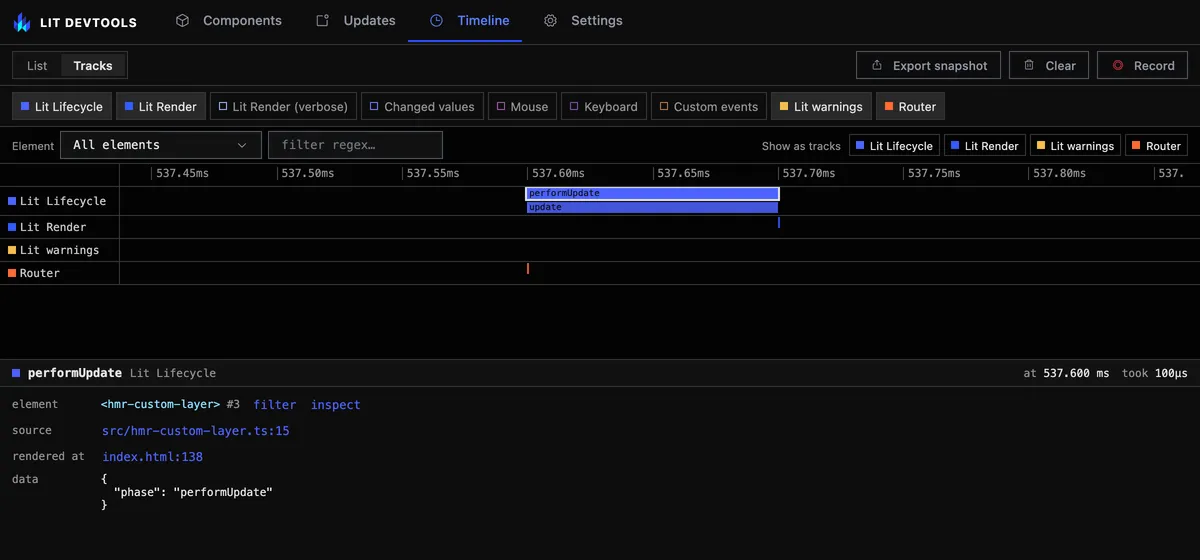
Each mark is one span, placed by its start and end. Overlapping spans stack
into rows, so an update tick reads as performUpdate on top with
willUpdate, update and updated beneath it. A point event, or a span too
short to show at the current zoom, draws as a thin tick. A span that has not
ended yet runs to the end of the recording.
- Wheel zooms around the pointer. Shift+wheel or a horizontal swipe pans.
- Drag pans.
- Double-click fits the whole recording again. While you record, a fitted view follows the newest events.
Click a mark to select it. The same detail pane opens under the tracks, and the selection carries over: switch back to List and it scrolls to that row.
The Tracks strip picks which lanes to draw. It is a view filter only. Hiding a track does not stop that layer being recorded, and the list is unaffected. Only layers you capture get a track, custom layers included.
The Element picker and the regex box above the list filter the tracks too, so a search you typed in one view still applies when you switch to the other.
Select a time range
Section titled “Select a time range”Shift+drag on the tracks, or drag on the time ruler above them, shades a range of the recording and shows its bounds and length while you drag. A click on the ruler, or Esc, clears it. To pick the range of one span from the keyboard, focus its mark and press Shift+Enter.
Both edges of the range are handles you can adjust. Drag one with the mouse, or Tab to it (they are announced as Range start and Range end sliders) and press ← or → to move it one axis tick step, or hold Shift for five. An edge stops at the other edge and at the ends of the recording, and the view scrolls to keep it on screen.
Copy link in the summary copies a link that opens the Timeline on the same range; see Link to a view below.
With a range drawn and no span selected, the detail pane summarises it:
- how long it is, and how many events each layer recorded in it;
- each component that updated, with its update count and total
performUpdatetime. filter narrows the list and the tracks to that element, and inspect opens it in the Components tab.
A span belongs to the range when it starts inside it, so a long span that begins before the range is not counted, and two neighbouring ranges never count the same span twice. The summary covers the lanes you are showing.
Selecting a mark replaces the summary with that span’s detail, and drawing a range clears the span selection. The detail pane holds one or the other.
- Zoom to range fits the view to the range, and stops following the newest events while you record.
- Filter to range adds a Time chip to the filter bar, and the list and the tracks then show only that window. Click the chip to show everything again.
See it in Chrome’s Performance panel
Section titled “See it in Chrome’s Performance panel”The panel’s tracks share a time axis with each other, not with the browser. To see Lit updates next to layout, paint, network and long tasks, mirror the timeline into Chrome DevTools’ Performance panel. Turn on performance tracks in the Settings tab, under Timeline, then record in Chrome as usual.
The recording gets a Lit track group with a Lifecycle and a
Render track, plus Render (verbose) and Input when those layers
are on. Lit warnings appear as markers on the Lifecycle track. Chrome lists it among the tracks as Lit — Custom, below
Interactions and above Main, and starts it collapsed: click its
arrow to open it. Each update tick is one entry named after its element, such
as <hmr-counter> performUpdate, with willUpdate, update, updated and
the render nested beneath it.
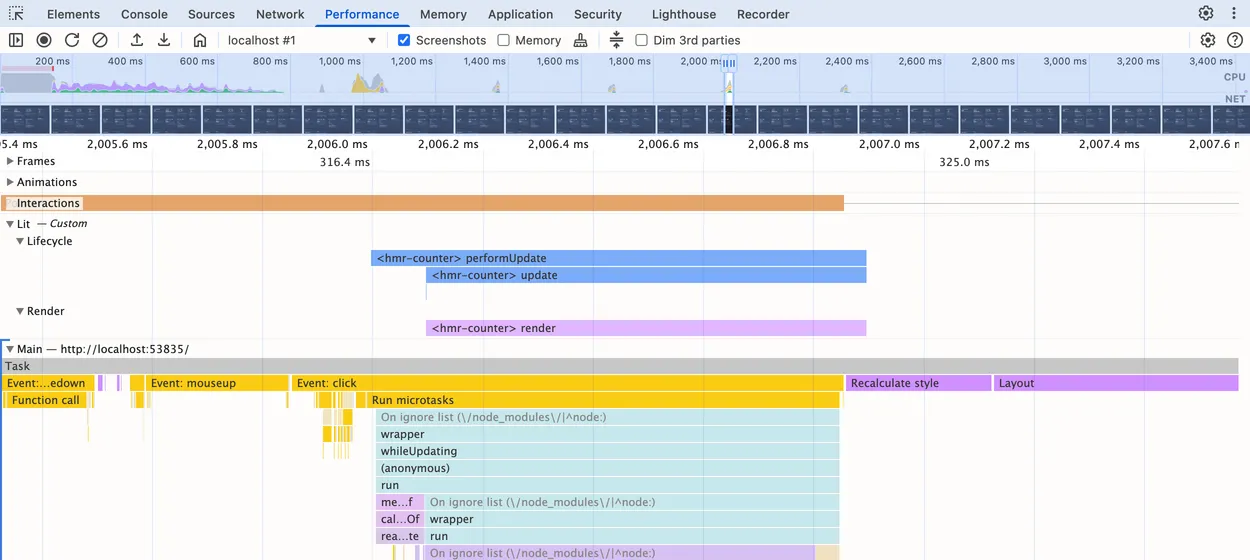
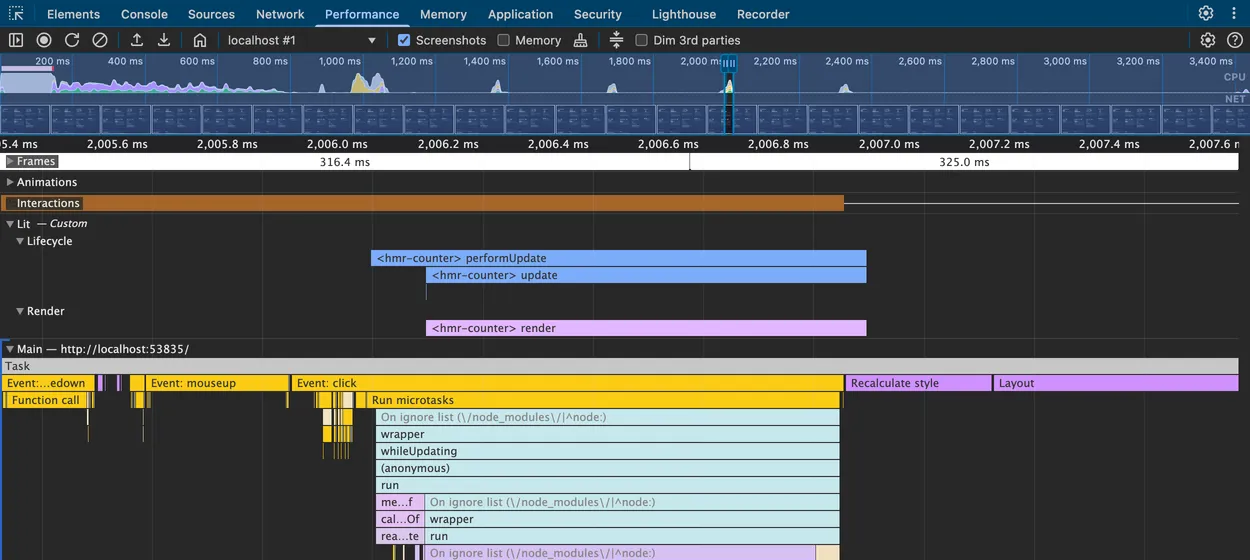
An update takes well under a millisecond, so at the default zoom an entry is
a sliver. Drag across the overview strip to select a stretch around an
interaction, then zoom in with the wheel or W until the labels
show. Entries shorter than a pixel, often willUpdate and updated, stay
hidden until you zoom further. Traces captured with an agent through
chrome-devtools-mcp contain the same entries, so an agent reading a trace
sees Lit’s work too.
- The mirror runs whether or not the Lit panel is recording. It follows the layers you picked in Choose layers, Lifecycle and Render by default.
- Chrome only keeps the entries while a Performance recording runs. Outside one, each call costs well under a microsecond. With the setting off, the page makes no calls at all.
- Entries are labels only. Chrome’s detail pane shows no changed properties and no source link; select the same tick in the Lit panel for those.
- Custom layers from
addTimelineEventstay in the Lit panel. - Updates that ran before the runtime installed, such as the first render on page load, are not in the trace.
In Firefox and older Chrome
Section titled “In Firefox and older Chrome”The tracks use console.timeStamp with its track arguments, which needs
Chrome 134 or newer. Older Chrome versions, Firefox and Safari ignore those
arguments, so there the same setting writes the entries as User Timing
instead: each update tick is a measure, each input event a mark, named
lit:<track> <label>, such as lit:Lifecycle <hmr-counter> performUpdate.
The Settings tab says so under the switch.
In the Firefox Profiler they appear in the Marker Chart and Marker
Table; type lit: in the search box to keep only Lit’s. The entries are
cleared from the page’s own performance timeline as soon as they’re made, so
performance.getEntriesByType('measure') doesn’t fill up with them.
- The entries belong to the page’s process, not the browser’s. Start and
capture the recording with Ctrl+Shift+1
and 2 (⌘ on macOS) while your page’s tab is active,
and select its track, labelled with the site’s host. A recording started
from
about:profilingopens on that page’s track (Privileged Content), which has no Lit entries; pick your tab in the tab selector at the top left. - Firefox rounds
performance.now()to whole milliseconds, and most updates take less. Their start and end land on the same tick, so most entries show as instants, and only updates longer than a millisecond show as bars.
Export a session for a bug report
Section titled “Export a session for a bug report”Export snapshot freezes the current session into a self-contained directory: the recorded events, the component tree, the details of everything you opened, and any HMR incompatibilities. The dev server writes it, and the panel reports where.
The result is a static site. Open index.html from any file server and the
panel renders the recording with no dev server, no checkout of the app and no
reproduction steps. The frozen panel is read-only: recording, picking and tree
refresh are hidden, because there is no page behind it to command.
Two limits matter when you record something to report.
- Only components you actually opened have their details baked in. Details are read from live DOM, so a component nobody inspected has nothing to freeze. Click through the ones that matter before exporting.
- The export holds the dev server’s latest 512 events, not the whole session: a long one exports its tail, as a reloaded panel shows it.
lit-devtools build does not produce one of these. A fresh CLI process has no
session to freeze, so export from the running server that recorded it.
Link to a view
Section titled “Link to a view”The panel is addressable. Opened on its own, or from an exported snapshot, it reads its position from the URL hash and keeps it up to date as you click. Copying the address bar gives a link that reopens the same view.
#tab=components&component=7tab is components, updates, timeline or settings. component is the
element id from the Components tree; on the Updates tab it selects the
component row that instance belongs to.
#tab=timeline&event=lq3x9-42event is the id of a timeline event. Selecting a row in the Timeline writes
the id of its start event into the hash, and opening the link selects the span
that event belongs to and scrolls it into view. The id is stamped when the
event reaches the dev server and is kept in an exported snapshot, so the link
works against a snapshot someone sent you. If the event has scrolled out of the
buffer, or the link came from another session, the Timeline opens with nothing
selected.
#tab=timeline&range=500-700range is a window of the recording, as start-end in milliseconds on the
same clock as the times in the list and the axis. Drawing a range writes it
into the hash, and Copy link in the range summary copies the whole address.
Opening the link switches to Tracks, draws the range and zooms to it.
A range is only meaningful against the recording it was drawn on, because the
clock restarts with each recording. So the link is applied once a span starts
inside the window, and until then it is held: a snapshot that is still loading,
or a live session still filling up, gets it as soon as its events arrive. It is
dropped, never applied, if you press Clear (or start a new recording) first,
and drawing your own range replaces it. A snapshot never re-zeroes, so a range
link is the reliable way to point someone at a stretch of an exported session.
When both event and range are present the range is drawn first and the
event is then selected.