
Inspect any site with Lit Inspector
Inspect the Lit components on any page, including production builds and sites you don’t serve, from a Lit tab in your browser’s DevTools. Skip this page if you only debug your own Vite app: the panel in Vite DevTools does more there.
 Get it on theChrome Web Store
 Coming soon toFirefox Add-ons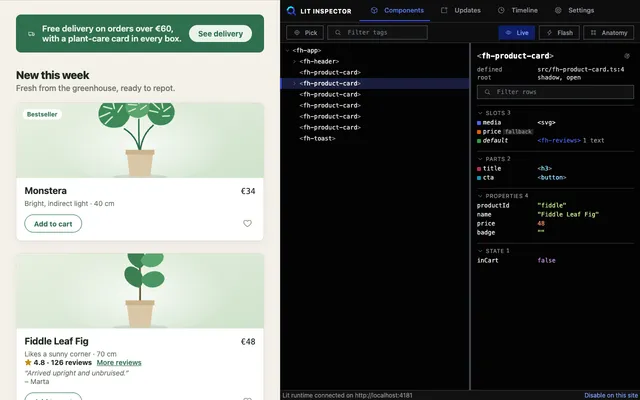
Lit Inspector is the same panel the Vite plugin serves, running inside a browser extension with no server behind it. The browser injects the runtime itself, so a page’s Content Security Policy can’t block it.
Install
Section titled “Install”Chrome
Section titled “Chrome”Install Lit Inspector from the Chrome Web Store with Add to Chrome. Chrome keeps it up to date.
To run a build that isn’t in the store yet, every GitHub
release also carries
lit-inspector-<version>.zip, which you load by hand:
-
Unzip it into a folder you keep. Chrome loads the extension from that folder every time it starts.
-
Open
chrome://extensionsand turn on Developer mode, top right. -
Click Load unpacked and pick the folder with
manifest.jsonin it.
An unpacked extension doesn’t update itself, and it sits next to the store version as a second Lit Inspector; turn one of them off.
Firefox
Section titled “Firefox”Lit Inspector isn’t on addons.mozilla.org yet. Load the zip from a GitHub release by hand:
-
Download
lit-inspector-<version>-firefox.zip. You need Firefox 140 or later. -
Open
about:debugging#/runtime/this-firefox. -
Click Load Temporary Add-on and pick the zip. Lit Inspector appears under Temporary Extensions.
Enable it on a site
Section titled “Enable it on a site”The extension asks for no site access at install and does nothing until you turn it on for a site.
-
Open DevTools on the page and go to the Lit tab.
-
In Chrome, click Enable on this site and allow access when Chrome asks. In Firefox, open the extension’s toolbar button (in the Extensions menu until you pin it) and click Enable on this site.
-
The page reloads. The Lit tab lists the page’s components.
Firefox enables a whole host on every port, so http://localhost:5173 turns
on http://localhost. To turn a site off, click Disable on this site at
the bottom right of the Lit tab.
Where a component is defined
Section titled “Where a component is defined”Without the Vite plugin, no build step tells the extension where a component lives. If the page ships sourcemaps, the extension works it out from them. The original file and line show in the details pane’s defined row, in the Updates view’s header for a component, and in the Timeline’s span details, and in Chrome a click opens it in the Sources panel.
The extension fetches the page’s scripts and their sourcemaps from the site to do this, so the maps must be reachable from the page. It only sees components defined after it injects, which on an enabled site is before the page’s first script runs.
Read component documentation
Section titled “Read component documentation”When a page links its
Custom Elements Manifests
with <link rel="custom-elements-manifest" href="…">, the details pane shows
what they say about the selected component: its description, events, CSS
custom properties, and descriptions on the property, attribute, slot and part
rows. See
Read a component’s documentation.
The extension resolves each link against the page’s base URL and fetches only
manifests on the enabled site; one on a CDN or another origin is skipped.
Open in the browser’s own panels
Section titled “Open in the browser’s own panels”The Lit panel and DevTools’ own panels hand off to each other:
- The details pane’s Reveal in Elements button, beside the scroll-into-view
button, selects the element in the Elements panel. It works in Chrome and
in Firefox, wherever DevTools offers
inspect(). - The other way round, selecting a node in the Elements panel selects its row in the Lit panel’s Components tab: the node itself if the tree lists it (a Lit element, an undefined tag or a non-Lit custom element), else the nearest one around it, through shadow roots.
- The defined link and, on a page built with the Vite plugin, the rendered link open in the Sources panel at that line. A source the plugin stamped is a file path, so the extension looks up the URL the page loaded for that file and opens it. If the page didn’t load the file, nothing opens. If you’ve connected a Chrome DevTools workspace to the project folder, Chrome maps the file to your disk and you can edit it there.
Opening in Sources needs Chrome: Firefox has no way for an extension to open it, so there the links stay plain text.
What the extension can’t do
Section titled “What the extension can’t do”The extension has no dev server behind it. Open in editor, Rendered at links
on a page without the plugin, hot patching, snapshot export and the MCP tools need the Vite plugin.
Render events on the timeline need Lit’s development build. It sees the top
frame of http: and https: pages only.
The extension collects no data. Its only network requests fetch an enabled site’s own scripts, sourcemaps and Custom Elements Manifests, from that site, to find where components are defined and what their documentation says. It stores the sites you enabled and your panel settings in your browser.